Human Engineering Research Laboratories, Department of Veterans Affairs, Pittsburgh, PA.
1Dept. of Mechanical Engineering, University of South Florida, 2 Dept. of Rehabilitation Science and Technology, University of Pittsburgh
ABSTRACT
This study evaluated the RT3 accelerometer to measure physical activity (PA) of individuals with spinal cord injury in terms of energy expenditure (EE). We also explored demographic and acceleration features that could contribute to estimation of EE related to PA. Two RT3 devices were placed on the arm and waist, respectively, of thirteen participants who performed resting, wheelchair propulsion, arm-ergometry, and deskwork. Results from RT3 were compared with the criterion values obtained via a metabolic cart. Although the predicted EE from RT3 was not accurate (111% overestimation on the arm and 22% underestimation on the waist), activity counts from RT3 correlated well with the criterion EE (r>0.75). The study also found that weight and some acceleration features were best predictors of EE.
KEYWORDS
Activity Monitors, Physical Activity, Energy Expenditure, Manual Wheelchair Users, Spinal Cord Injury
INTRODUCTION
Mobility impairments are one of the most prevalent types of disability [(1), (2), (3)]. In the United States, according to the 2000 Census, there are 21.2 million Americans with some type of mobility impediment [(4)]. Although new medicines and technology have improved the quality of life of these individuals, there is still a concern about their health, as many of them adapt sedentary lifestyles and refrain themselves from physical activities (PA). People with spinal cord injury (SCI) are part of this current problem. Only 13%-16% of persons with this condition perform consistent physical activity [(5)] and the majority of them report virtually no regular PA [(5), (6)]. This inactivity usually results in pain, fatigue, weight gain, and deconditioning [(7)] that could also lead to more serious illnesses like cardio vascular and respiratory-related diseases.
Advancements in assistive technology are aimed to help individuals with disabilities regain their physical health. Activity monitors are devices that assess, motivate, and educate the population on their physical health [(8)] by providing them with accurate information on their activity patterns. These devices are very important to monitor population health and design effective interventions [(9)]. Studies have evaluated the accuracy of the RT3 tri-axial accelerometer in children, people with multiple sclerosis and overweight adults. In these studies it was found that the activity counts (a proprietary measure) from RT3 on the waist correlated well with the criterion EE, but the EE outputs from RT3 did not agree well with the criterion EE [(10, 11)]. Despite some limitations, the RT3 was found to be a useful tool for the assessment of PA in the ambulatory population [(10)]. Manual wheelchair users with SCI could benefit from such devices; however, there haven’t been many studies that validate these activity monitors among this group. The aim of this study was to investigate the performance of the RT3 on people with SCI and explore variables that could improve current EE prediction models for this population.
METHODS
In order to participate in the study, subjects were required to be between 18 and 60 years of age, use a manual wheelchair as primary means of mobility, be at least six months post-injury, and have a SCI of T1 or below. They were contacted via flyers, advertisements, and through the Institutional Board (IRB) approved registries. Before they started with the activities, their weight, height, and skin fold measurements were recorded. Participants were then asked to do eight activities for eight minutes each. These were: resting, wheelchair propulsion (2mph and 3mph on a Dynamometer, and 3mph in a flat tiled floor), arm-ergometer exercise (at 60 rpm-20 Watts, 60 rpm-40 Watts, and 90 rpm-40 Watts), and desk work (reading a book and typing on a computer).
Participants wore the Cosmed K4b2 portable metabolic cart and two StayHealthy RT3 tri-axial accelerometers, one placed on the left arm and the other one on the waist. The RT3 is a pager-size single sensor activity monitor that measures acceleration in three directions (anterior-posterior, lateral, and vertical) and it also calculates the vector magnitude of the three. This lightweight (2.3 oz) accelerometer uses activity counts, a dimensionless unit based on mass times integrated acceleration, to calculate energy expenditure (EE) based on proprietary regression equations. These activity counts also represent acceleration information from each activity. The criterion EE was retrieved from the metabolic cart which measured the oxygen consumption and carbon dioxide production from each subject during the entire study. These values were then used to calculate energy expenditure based on standard equations from the device.
For the analysis, data from the third to the sixth minute was selected from the metabolic cart and RT3 from arm and waist using MATLAB (R2008a, The Math Works, Inc.). This four minute data was also used to calculate acceleration parameters.
Data analysis
All statistical analyses were performed using SPSS for windows (version 17.0, SPSS, Inc.), and significance level was set at α< 0.05. Since this study had a small sample (thirteen participants), non-parametric test was chosen.
For the first part of the data analysis the Wilcoxon signed rank sum test was used to compare the EE values from the two RT3s with the criterion EE. Also, the correlation of activity counts (acceleration data) from both RT3s with criterion EE was evaluated using Spearman’s rho test.
The second part of the analysis was to select the best attributes among the demographics of participants and acceleration features using the WEKA data mining software. The demographic variables were weight, age, and percent body fat. A custom MATLAB program was used to calculate eight acceleration features (Table 1) from each RT3 device.
| Parameter Name | Description | Relationship with Physical Activity |
|---|---|---|
| Mean |  |
Tendency of the measured activity |
| Integral | Left hand Riemann sum | Accumulation of measured activity |
| Peak | Maximum absolute value | Point estimate of the peak activity intensity |
| Inter-quartile Range |  |
Is data distributed evenly among all PA intensities |
| Kurtosis |  |
Does the minute have a single large peak or is the activity more evenly distributed over all measured values |
| Mean Absolute Error |  |
Measurement of the activity variability |
| Coefficient of Variance |  |
Variability during the each minute |
We chose to use the Cfs Subset Evaluator which assesses the predictive ability of each attribute individually and the degree of redundancy among them, preferring sets of attributes that are highly correlated with the criterion EE but have low intercorrelation. The Best First search method was selected to traverse the attribute space to find a good subset. This option “searches the space of attribute subsets by greedy hillclimbing augmented with a backtracking facility” (Weka 3.6 Data Mining Software). The 10-fold cross-validation method was used to evaluate the result. Those attributes that appear 100% (present in all 10 folds) were selected.
RESULTS
Demographics
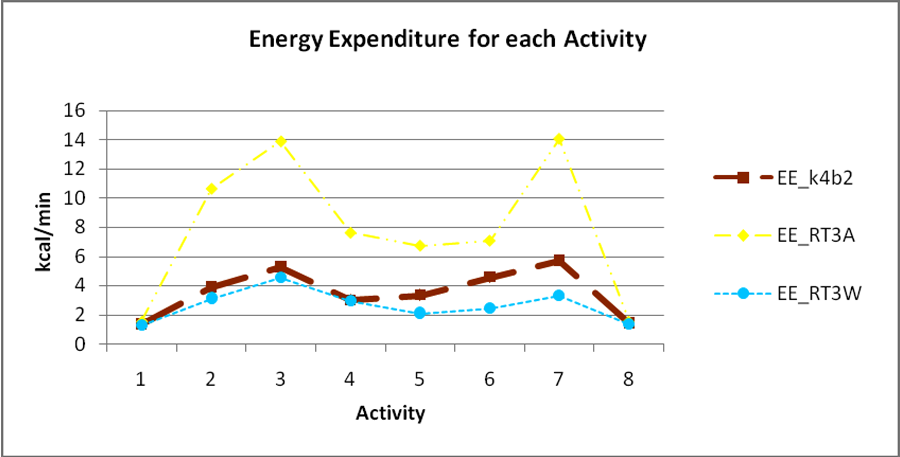 Figure 1. Plot comparing EE from RT3A, RT3W, and criterion EE. 1-Resting, 2-2mph Dyna, 3-3mph Dyna, 4-3mph flat tiled floor, 5-20W60rpm, 6-40W60rpm, 7-40W90rpm, 8-Deskwork
Ten males and three females participated in the study. Their ages ranged from 26 to 59 years old, with an average of 44±10 years. The average body weight and height of the participants were 79.8±19.6 kg and 178.7±10.5 cm, respectively. Four skinfold measurements at triceps, bicep, subscapula, and suprailiac were 17.9±9.5 mm, 9.8±6.9 mm, 19.1±8.1 mm, 20.6±8.3 mm, respectively. The percent body fat estimated based on the total skinfold measurement and age was 28.0±6.0% [(12)].
Comparison of EE from RT3 and metabolic cart
Table 2 shows the EE average from RT3 and metabolic cart for all subjects per activity and the results of the Wilcoxon signed rank test. P-value less than 0.05 are shown with an asterisk. Figure 1 represents graphically the difference between EE values.
| Activity | Metabolic Cart | RT3W | Wilcoxon z-value | P-value | RT3A | Wilcoxon z-value | P-value | |
|---|---|---|---|---|---|---|---|---|
| Resting | 1.4 (0.5) | 1.3(0.2) | 0.078 | 0.937 | 1.6(0.8) | 1.293 | 0.196 | |
| Wheelchair propulsion | 2mph on Dyno | 3.9 (1.7) | 3.1(1.6) | 1.647 | 0.099 | 10.6(5.3) | 3.180 | 0.001* |
| 3mph on Dyno | 5.3 (2.7) | 4.6(3.7) | 0.784 | 0.433 | 13.9(6.9) | 3.180 | 0.001* | |
| 3mph on Tile | 3.0 (1.1) | 3.0(1.4) | 0.235 | 0.814 | 7.6(3.3) | 3.110 | 0.002* | |
| Arm-ergometry | 20W at 60 rpm | 3.4(0.5) | 2.1(1.0) | 2.824 | 0.005* | 6.8(3.9) | 2.691 | 0.007* |
| 40W at 60 rpm | 4.6 (0.7) | 2.5(1.4) | 2.903 | 0.004* | 7.1(3.4) | 2.691 | 0.007* | |
| 40W at 90 rpm | 5. 7(0.7) | 3.4(1.6) | 2.903 | 0.004* | 14.1(8.7) | 2.900 | 0.004* | |
| Deskwork | 1.5 (0.4) | 1.4(0.3) | -0.314 | 0.314 | 1.6(0.4) | -1.083 | 0.279 | |
Comparison of Activity counts from RT3 and EE from metabolic cart
Table 3 shows Spearman’s rho correlation and significance level for activity counts and criterion EE for Comparison of Activity counts from RT3 and EE from metabolic cart.
|
RT3 Arm |
RT3 Waist |
||
|---|---|---|---|---|
Activity |
R |
P-value |
R |
P-value |
Wheelchair Propulsion |
0.544 |
0.00** |
0.347 |
0.038* |
Arm-ergometry exercise |
0.569 |
0.00** |
0.403 |
0.015* |
All Activities |
0.844 |
0.00** |
0.752 |
0.00** |
Demographic and Acceleration Features
Among the three demographic features and eight acceleration features calculated from RT3 on the waist and on the arm, the WEKA results indicated that four attributes including weight, mean and coefficient of variance from RT3 on the arm, and kurtosis from RT3 on the waist were the best (100%) attributes for EE prediction.
DISCUSSION/CONCLUSION
Based on the results of this study, RT3 was not very accurate in predicting EE (111%-arm, -22%-waist), particularly for high intensity activities (wheelchair propulsion and arm-ergometry). The reason for this being that the prediction algorithm used by the RT3 was developed based on ambulatory populations. For activities like resting and deskwork, EE was not very different (14%-arm, -4%-waist) because these types of activities are the same for everyone. For wheelchair propulsion, the RT3 on the waist performed better than the one on the arm, because it is likely that the accelerometer on the waist was able to capture the small up and down movements around the waist during active propulsion. For arm-ergometry exercise, the RT3 on the waist underestimated PA by 45%, because there were less trunk excursions during arm-ergometry and thus less up and down movements around the waist. The RT3 on the arm seemed to perform poorly in this study, mainly because the EE prediction algorithm in RT3 was developed based upon the activity counts around the waist. When examining the correlations between raw activity counts and criterion EE, the counts on the arm demonstrated a better correlation with the criterion EE than the counts collected on the waist, indicating the arm could be a potential location to place the RT3 and yield better prediction accuracy. This study also investigated the contribution of demographics and acceleration data to energy expenditure. Based on the WEKA results weight, mean and coefficient of variance from RT3 on the arm, and kurtosis from RT3 on the waist were found to be potential predictors of EE. The fact that two acceleration features from the arm were selected may also indicate that the arm could be a good location to place the RT3 and monitor physical activity levels of wheelchair users.
The findings of the study showed that the RT3 could potentially be a good tool to monitor physical activity related EE among wheelchair users, however, current algorithms have to be changed to improve its prediction accuracy. This population could greatly benefit from activity monitors that accurately measure their physical activity. Physicians could use this information to monitor patients, follow up on therapies, and develop better interventions to help individuals regain their physical health. Future work of this study is to include more subjects to collect more information and generalize results.
REFERENCES
- Spinal Cord Injury Facts and Statistics. Retrieved August 10, 2009, from http://www.sci-info-pages.com/facts.html
- Factsheet on Persons with Disabilities. Retrieved July 19, 2009, from UN Enable Web site: http://www.un.org/disabilities/default.asp?id=18
- Kaye, H. S., Kang, T., and LaPlante, M. P. (2002). Wheelchair Use in the United States. Retrieved July 18, 2009, from Disability Statistics Center, University of California Web site: http://dsc.ucsf.edu/publication.php
- US Census Bureau (2000). Retrieved August 10, 2009, from http://www.census.gov/prod/2003pubs/c2kbr-17.pdf
- Washburn, R. and B.N. Hedrick, (1997). Descriptive epidemiology of physical activity in university graduates with locomotor disabilities. International Journal of Rehabilitation Research, 20(3), 275.
- Washburn, R.A., et al. (2002). The physical activity scale for individuals with physical disabilities: development and evaluation. . Archives of Physical Medicine and Rehabilitation, 2002. 83: p. 193-200.
- Kinne, S., D.L. Patrick, and D.L. Doyle. (2004) Prevalence of secondary conditions among people with disabilities. American Journal of Public Health, 94(3): p. 443-445.
- SenseWear. Bodymedia Retrieved July 20, 2009 from Bodymedia Web site: http://www.sensewear.com/BMS/solutions_bms.php
- Maddison, R. (2009). Estimating energy expenditure with the RT3 triaxial accelerometer. (physiology)(Product/service evaluation)(report). Research Quarterly for Exercise and Sport, 80(2), 249
- Kavouras, S. (2008). Assessment of energy expenditure in children using the RT3 accelerometer. Journal of Sports Sciences, 26(9), 959.
- Hale, L. (2007). Reliability of RT3 accelerometer for measuring mobility in people with multiple sclerosis: Pilot study. Journal of Rehabilitation Research and Development, 0748-7711, 619.
- Duncan, J.V.G.A. and J. Womersley. (1974) Body fat assessed from total body density and its estimation from skinfold thickness: measurements on 481 men and women aged 16 to 72 years. British Journal of Nutrition, 32(1): p. 77-97.
- Hiremath,S (2009). Evaluation of Accelerometer-based Activity Monitors to Assess Energy Expenditure of Manual Wheelchair Users with Spinal Cord Injury (Masters dissertation, University of Pittsburgh, 2009)
ACKNOWLEDGEMENTS
Funding for this research was provided by the National Science Foundation, Project EEC 0755184.
The work is supported by RERC on Recreational Technologies and Exercise Physiology Benefitting Persons with Disabilities (H133E070029) funded by National Institute on Disability Rehabilitation Research (NIDRR). The work is also supported by PVA 2264-01 and VA Center of Excellence for Wheelchairs and Associated Rehabilitation Engineering B3142C.
CONTACT INFORMATION
Adriana Chacon. 4411 14th Ave. E Bradenton, FL 34208. 941-773-5580. achacon@mail.usf.edu